Hemnet, Sweden’s largest residential property portal, went public last year. Its business is similar to Zillow in the U.S., REA Group in Australia, and Rightmove in the UK. Although Hemnet has the attractive financials of a dominant marketplace, its business is even more attractive than the aforementioned geographical peers.
DOMINATING COMPETITORS AND PEERS
Since its founding in 1998, Hemnet has grown into Sweden’s largest online property listing service. When comparing Hemnet to its peers in other geographies, we can see the true extent of its dominance. The table below shows the competition within the respective real estate classifieds markets, and shares several key performance indicators between the market leader and the closest competitor:
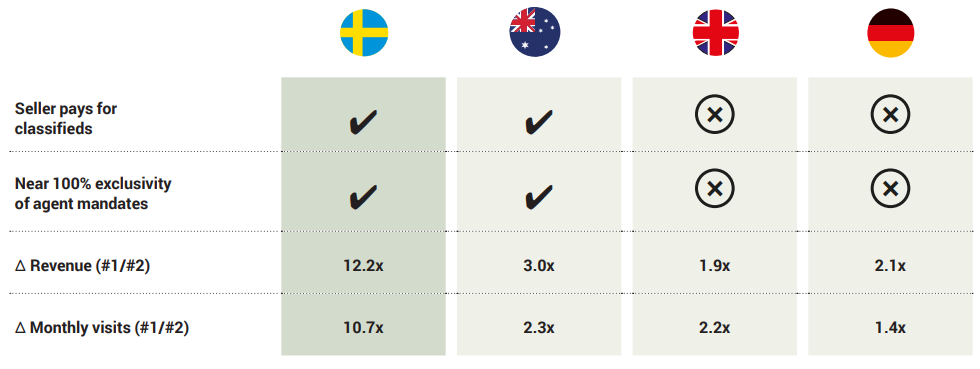
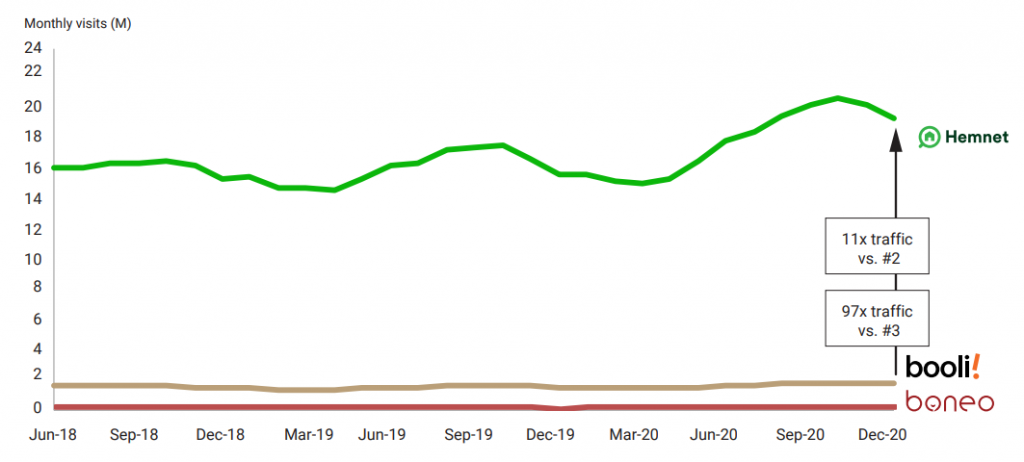
Relative to its closest competitor in Sweden (Booli), Hemnet has 12.2x revenues and 10.7x the monthly web traffic. Compare this to REA Group that is dominant in Australia. REA only has 3x the revenues and 2.3x the web traffic relative to its own closest competitor.
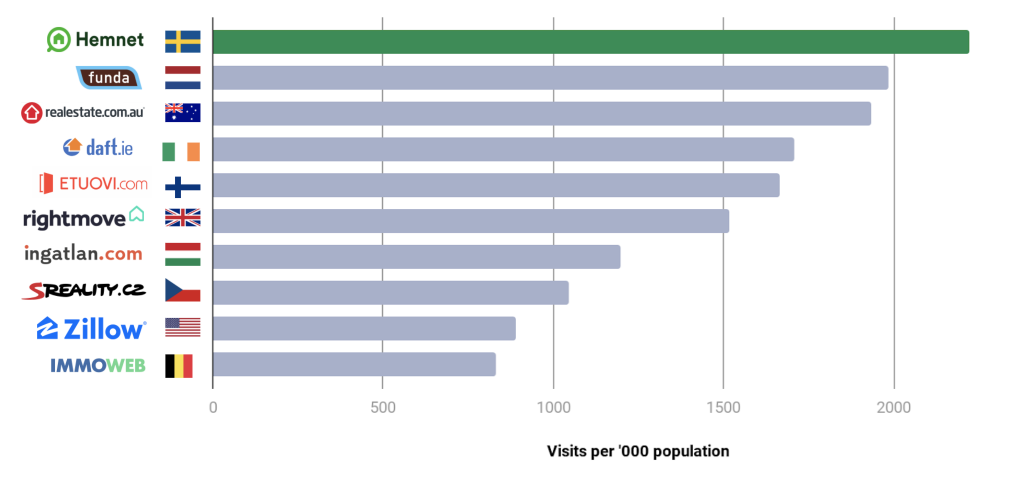
Even more amazing is the fact that Hemnet is the most popular property platform in the world when measured by visits per capita. Another measure of Hemnet’s popularity is the fact that the average Swede spends 38 minutes on Hemnet every month.
STABLE & RESILIENT HOUSING MARKET
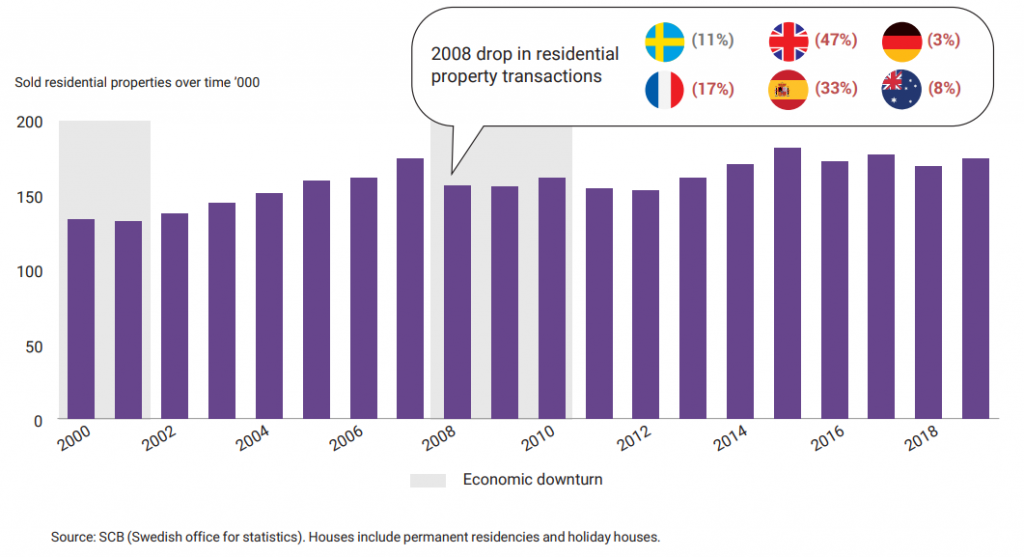
Another attractive feature of Hemnet is that a stable and resilient real estate market supports its business. During the Great Financial Crisis in 2008, the number of real estate transactions in Sweden dropped only 11%. Compare this to larger European markets. The UK shrank by 47% and Spain by 33%.
OPPORTUNITY TO GROW SALES AND MARGINS
With the top position in Sweden, one might be right to ask whether there’s any opportunity left to grow. We think the answer is a definite “Yes” for two reasons.
First, there is a wide gap in revenues earned per listing between Hemnet and leaders in other geographies. The difference in revenue per listing between Hemnet and REA Group in Australia is 5.6x.
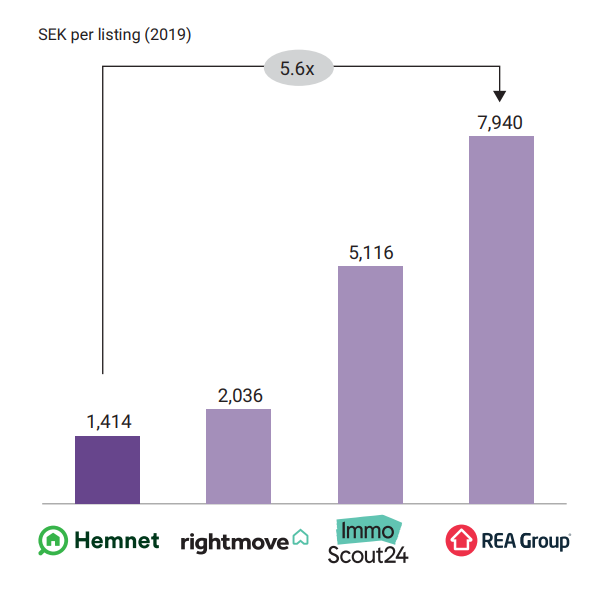
Second, Swedes spend very little on real estate classifieds advertising. When looking at this spending as a percent of average property value, Sweden and Hemnet are at the bottom. The gap between Sweden and Australia is 5.9x.
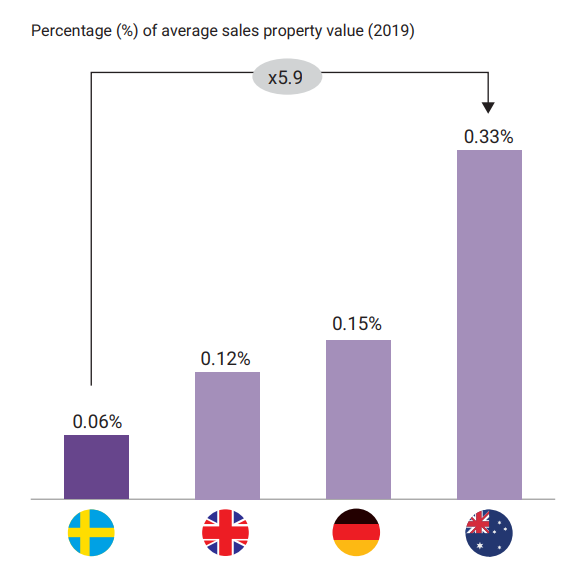
These two reasons are why there is very likely a decade of above-average revenue growth for Hemnet. The company can bridge these two gaps by increasing its listing fees, adding enhanced services, and by adding ancillary services for listing agents and home buyers/sellers.
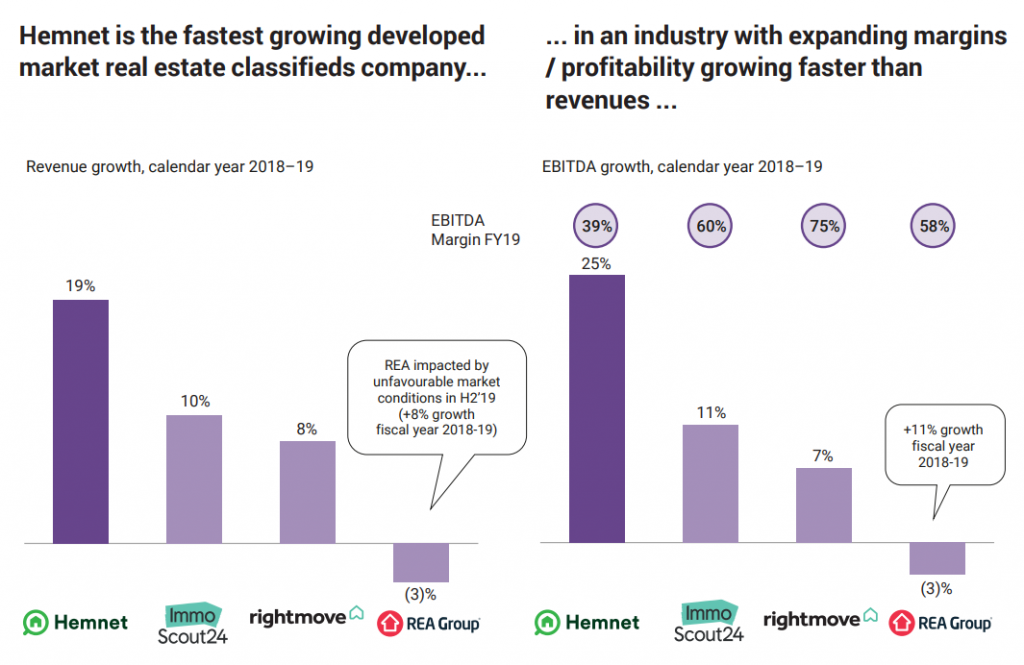
Further, by growing revenues from a relatively fixed cost base, Hemnet will also bridge the gap between its current margins and the higher margins of its peers. As shown below, Hemnet already has excellent adjusted EBITDA margins of 39%. However, there is an opportunity to expand margins by 10–20 points. Hemnet's peers, Rightmove and REA, have margins of 75% and 58%, respectively.
ANDVARI TAKEAWAY
Hemnet has many qualities that Andvari likes. It is a dominant marketplace that comes with extraordinarily high margins (see our post about online marketplaces, "The Fulcrum of Scale and Profitability"). A uniquely robust real estate market underpins Hemnet’s business. And despite a commanding market share, Hemnet still has not reached its full potential. Hemnet’s financial goals are revenue growth of 15–20 percent and to achieve adjusted EBITDA margins of 45–50 percent. Further, we suspect few investors outside of Sweden are aware of Hemnet’s existence, which could mean a better opportunity to purchase shares in a wonderful business at a fair price.
_________
_________
IMPORTANT DISCLOSURE AND DISCLAIMERS
Investment strategies managed by Andvari Associates LLC ("Andvari") may have a position in the securities or assets discussed in this article. At the time of publication of this blog, Andvari clients had no position in Hemnet. Andvari may re-evaluate its holdings in any mentioned securities and may buy, sell or cover certain positions without notice.
This document and the information contained herein are for educational and informational purposes only and do not constitute, and should not be construed as, an offer to sell, or a solicitation of an offer to buy, any securities or related financial instruments. This document contains information and views as of the date indicated and such information and views are subject to change without notice. Andvari has no duty or obligation to update the information contained herein. Past investment performance is not an indication of future results. Full Disclaimer.
© 2021 Andvari Associates LLC


