Below is our latest letter to clients. Please share and enjoy.
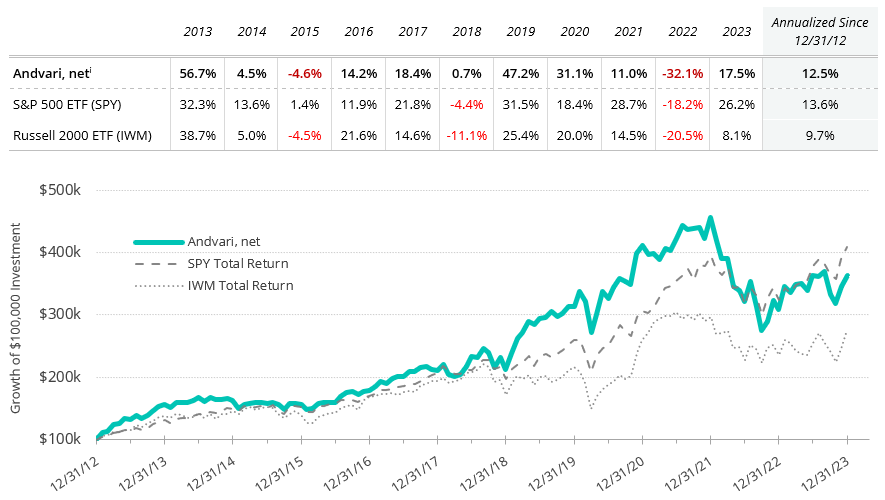
For the full year of 2023 Andvari was up 17.5% net of fees while the SPDR S&P 500 ETF was up 26.2%.* Andvari clients, please refer to your reports for your specific performance and holdings. The table below shows Andvari’s composite performance against two benchmarks while the chart shows the cumulative gains of a $100,000 investment.
ANDVARI HOLDINGS
Looking at the holdings which we held at the beginning of 2023 and that remained at the end of the year, there was a wide mix of good and bad performers. The worst performing holding was Mesa Labs whose shares had a total return of -36.7% for the year. The reasons for poor performance remain the same. First, they lost a significant customer in their Clinical Genomics business. Second, Mesa and the life sciences industry in general continued to experience the negative effects of customers de-stocking the inventories they had built up after the pandemic. Likely third and fourth reasons are higher interest rates and the overhang of Mesa’s $173 million worth of convertible debt which comes due in 2025. Mesa has the option of satisfying this debt either through issuing new common shares, with cash, or some combination of both. Neither are great options right now. Issuing new shares at low prices will excessively dilute shareholders. If Mesa wants to refinance this debt, they would be doing so at a much higher rate.
Turning to some positive news, Andvari’s best performing holding in 2023 was Constellation Software whose stock had a total return (share price and dividends) of 58.9%. Constellation’s spin-offs, Topicus.com and Lumine, also had stellar years. In just twelve months, Constellation acquired over 100 niche, vertical market software businesses. Most of the acquisitions were small enough that the purchase price was not reported. However, there were several large transactions in 2023 where Constellation was able to allocate hundreds of millions of capital.
To demonstrate the solid growth and compounding of Constellation’s results, it was just 7 years ago in 2016 that the company first reported annual revenues of $2 billion. Starting with the second quarter of 2023, Constellation reported $2 billion of revenues for a single quarter. Although Constellation has not yet reported its results for 2023, Andvari believes annual revenues will be at least $8.2 billion and free cash flows will be about $1.7 billion.
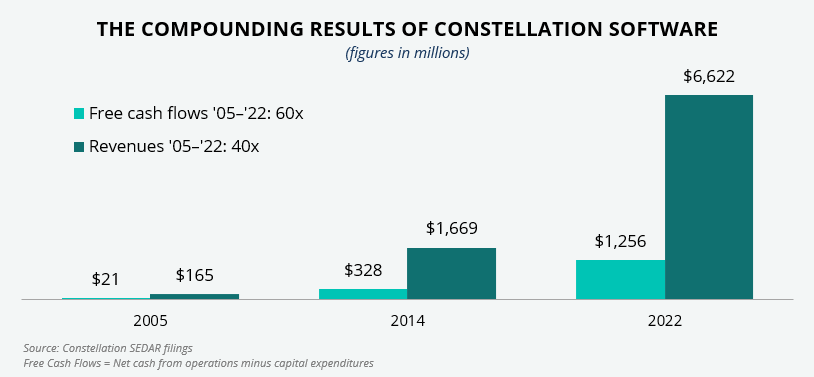
Because the businesses Constellation acquires usually have high margins and low organic growth, Constellation is not able to fully reinvest the cumulative free cash flows back into the businesses it owns. Thus, much of the intrinsic value of Constellation is dependent upon its ability to reinvest these free cash flows at high rates of return by acquiring more mission critical software businesses around the world.
As Constellation has grown larger, it has continued to produce excellent results by maintaining its decentralized operating structure. Constellation founder and CEO Mark Leonard has also pushed down capital allocation responsibilities further and further down to business unit leaders. Whereas ten years ago Leonard and the board of directors would be approving nearly every proposed acquisition, business unit leaders now decide for themselves whether to pursue an acquisition if the purchase price is below a certain threshold. Leonard and the board of directors now only consider large acquisitions. This delegation of responsibility has allowed Constellation to deploy capital at a sustained and rapid pace.
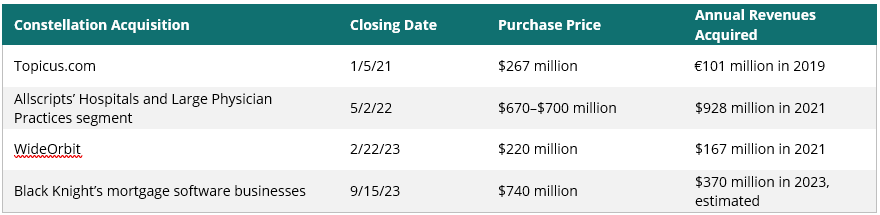
Finally, it’s important to note Constellation’s acquisition criteria have evolved slightly to enable the acquisitions of larger businesses while maintaining a relatively high hurdle rate for returns. Small acquisitions have been Constellation’s bread and butter for decades. Average returns on these have been 20% or higher. But to be competitive in large deals that have a purchase price of $100 million or more, Constellation has conceded it must accept a return in the mid-teens. This is still quite high by the standards of any investor. As shareholders, we’ve seen a handful of larger deals come to fruition in the last several years. Some examples are in the table below.
In sum, Constellation remains an impressive business. Andvari estimates Constellation is currently trading at a forward free cash yield of just under 3%. This, coupled with a track record of having compounded free cash flows at an annualized rate of 18.8% over the last eight full fiscal years, suggests future returns to shareholders are likely to remain above average even if free cash flow growth declines to the low teens.
ANDVARI TAKEAWAY
We’re pleased to report positive results for 2023, but Andvari is still unhappy to be trailing one of the best-known benchmarks, the S&P 500. As unpleasant as it is for us, we must expect this to happen from time to time. To achieve differentiated results, it makes sense to us that we must act differently. Nearly half of Andvari’s assets under management are not part of the S&P 500 index. Furthermore, we run a concentrated investment strategy which can exacerbate results in the short-term.
As always, Andvari does its best to remain focused on what we can control. And that is identifying and studying high quality businesses with excellent managers that can deploy capital at high rates of return for a long period of time. Buying shares of these businesses at sensible prices skew the odds in our favor of producing excellent returns over the long-term for ourselves and for our clients.
As always, I love to hear from clients and anyone else. Please contact me with your thoughts, comments, or questions.
Sincerely,

Douglas E. Ott, II
DISCLOSURES AND END NOTES
* Andvari performance represents actual trading performance of all, actual clients beginning on 4/12/13, managed under the primary Andvari investment strategy. Performance from 12/31/12 to 4/12/13 is actual performance of proprietary accounts, namely the accounts of Andvari’s principal, Douglas Ott. Andvari believes including Ott’s performance figures for the first 4 months and 12 days of 2013 is fair as he managed those accounts similarly to Andvari’s first clients. All performance, including the initial proprietary period, are net of management fees—assumed to be 1.25% per annum, paid quarterly, as currently advertised—net of brokerage commissions and expenses, time-weighted, and includes all cash and other securities. Performance includes realized and unrealized returns and excludes the effects of taxes on incurred gains or losses. Andvari does not certify the accuracy of these numbers. Performance data quoted represents past performance and does not guarantee future results.
The index ETFs are listed as benchmarks and are total return figures and assumes dividends are reinvested. The S&P 500 ETF (SPY) is an exchange traded fund based on the S&P 500 index, which is a float-adjusted, capitalization-weighted index of 500 U.S. large-capitalization stocks representing all major industries. The Russell 2000 ETF is an exchange traded fund based on the Russell 2000 Index, which is an index of 2,000 U.S. small-cap stocks. It is not possible to invest directly in an index. Because Andvari client portfolios are non-diversified, the performance of each holding will have a greater impact on results and may make them more volatile than a more diversified index. Andvari also engages or may engage in strategies not employed by the S&P 500 or the Russell 2000 including, without limitation, the use of leverage.
One may request a list of all securities mentioned or recommended for the preceding year as of the date of this letter. You may contact Andvari using the information below. Actual client results may differ from results depicted in this letter. Any investment involves substantial risks, including, but not limited to, pricing volatility, inadequate liquidity, and the loss of principal. Investment strategies managed by Andvari Associates LLC may have a position in the securities or assets discussed in this article. Securities mentioned may not be representative of the Andvari's current or future investments. Andvari may re-evaluate its holdings in any mentioned securities and may buy, sell or cover certain positions without notice.
The discussion of Andvari’s investments and investment strategy (including, but not limited to, current investment themes, the portfolio managers’ research and investment process, and portfolio characteristics) represents the views and opinions of Andvari’s portfolio managers and Andvari Associates LLC, the investment adviser, at the time of this report, and can change without notice.
This document does not in any way constitute an offer or solicitation of an offer to buy or sell any investment, security, or commodity discussed herein or of any of the affiliates of Andvari.
The information contained in this document may include, or incorporate by reference, forward-looking statements, which would include any statements that are not statements of historical fact. Any or all of Andvari’s forward-looking assumptions, expectations, projections, intentions or beliefs about future events may turn out to be wrong. These forward-looking statements can be affected by inaccurate assumptions or by known or unknown risks, uncertainties, and other factors, most of which are beyond Andvari’s control. Investors should conduct independent due diligence, with assistance from professional financial, legal and tax experts, on all securities, companies, and commodities discussed in this document and develop a stand-alone judgment of the relevant markets prior to making any investment decision.