Below is our latest letter to clients. You may download the full PDF here. Please share and enjoy.
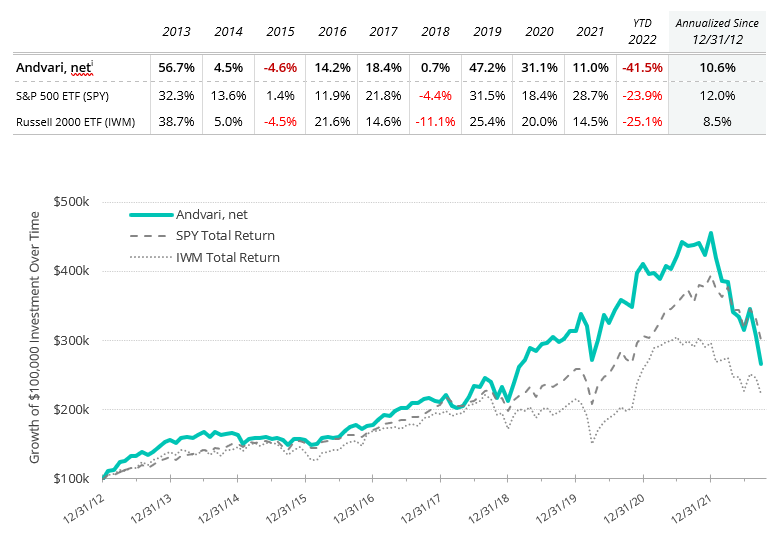
For the first nine months of 2022 Andvari was down 41.5% net of fees while the SPDR S&P 500 ETF was down 23.9%. Andvari clients, please refer to your reports for your specific performance and holdings. The table below shows Andvari’s composite performance against two benchmarks while the chart shows the cumulative gains of $100,000 investments.
ANDVARI HOLDINGS
Stock market indices recorded their worst first nine months of the year since 2002. The share prices of most of the companies we own continued to fall during the third quarter. With only a few exceptions, our holdings continue to underperform the market year to date.
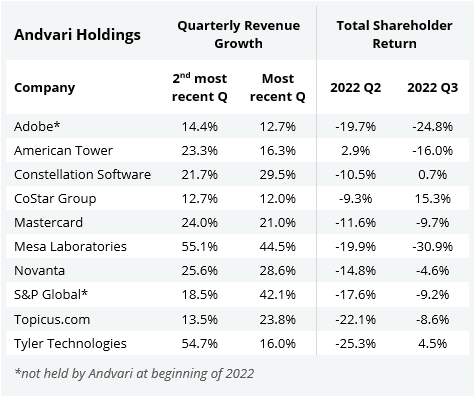
The reasons for the underperformance remain the same. The companies we tend to own are of the “growthier” variety (see the table on the next page). These are the types of companies that can underperform in the short run during a period of rising interest rates.
Furthermore, as we have frequently reminded you over the years, Andvari’s style of investing in a small number stocks lends itself to bouts of exaggerated performance. In some years Andvari has outperformed the market by wide margins: by 24 percentage points in 2013, 15 points in 2019, and 12 points in 2020. In some years Andvari has underperformed by wide margins: 9 percentage points in 2014, 17 points in 2021, and thus far in 2022 by 17 points. However, Andvari believes volatility is a price worth paying if it leads to outperformance over the long run.
Thus far in 2022, the underlying businesses of Andvari’s holdings continue to perform well. Quarterly revenue growth for all holdings has been squarely in the double digits for their two most recent quarters. This growth for our holdings is usually some combination of organic and inorganic (i.e., growth has come by acquiring other companies). Whatever the exact source of growth, Andvari believes the companies in which it is a part owner are allocating capital at high rates of return.
The only company-specific news worth mentioning is Adobe’s announcement in September that it will acquire collaborative design platform Figma for $20 billion. Adobe’s share price dropped 16.8% on the day of the announcement. Shareholders signaled that paying an extraordinary 50x Figma’s annualized run-rate revenues is likely to destroy value.
Although Andvari is skeptical of this deal, there are a few reasons why it could turn out to be a decent use of capital. First is Figma’s astounding growth. Since its first dollar of revenue in late 2017, Figma has grown to $400 million in annualized revenues in just five years. Furthermore, they achieved this growth through the viral adoption of their product, not by employing an army of salespeople. Second, Adobe is experienced at acquiring products and then accelerating growth with its distribution network and access to large enterprise customers. Adobe built its suite of products over the decades by making over fifty acquisitions. Adobe even acquired its best-known product, Photoshop. Andvari thinks Figma can continue its rapid growth when it has access to Adobe’s ability to spend $5 billion annually on sales and marketing.
LOOKING TO HISTORY
Amid challenging times, Andvari often takes solace and inspiration from history. Over the last few months, we’ve spent many hours reading old issues of Business Week, Fortune and The New York Times to give us some perspective on what our economy and markets have experienced this year.
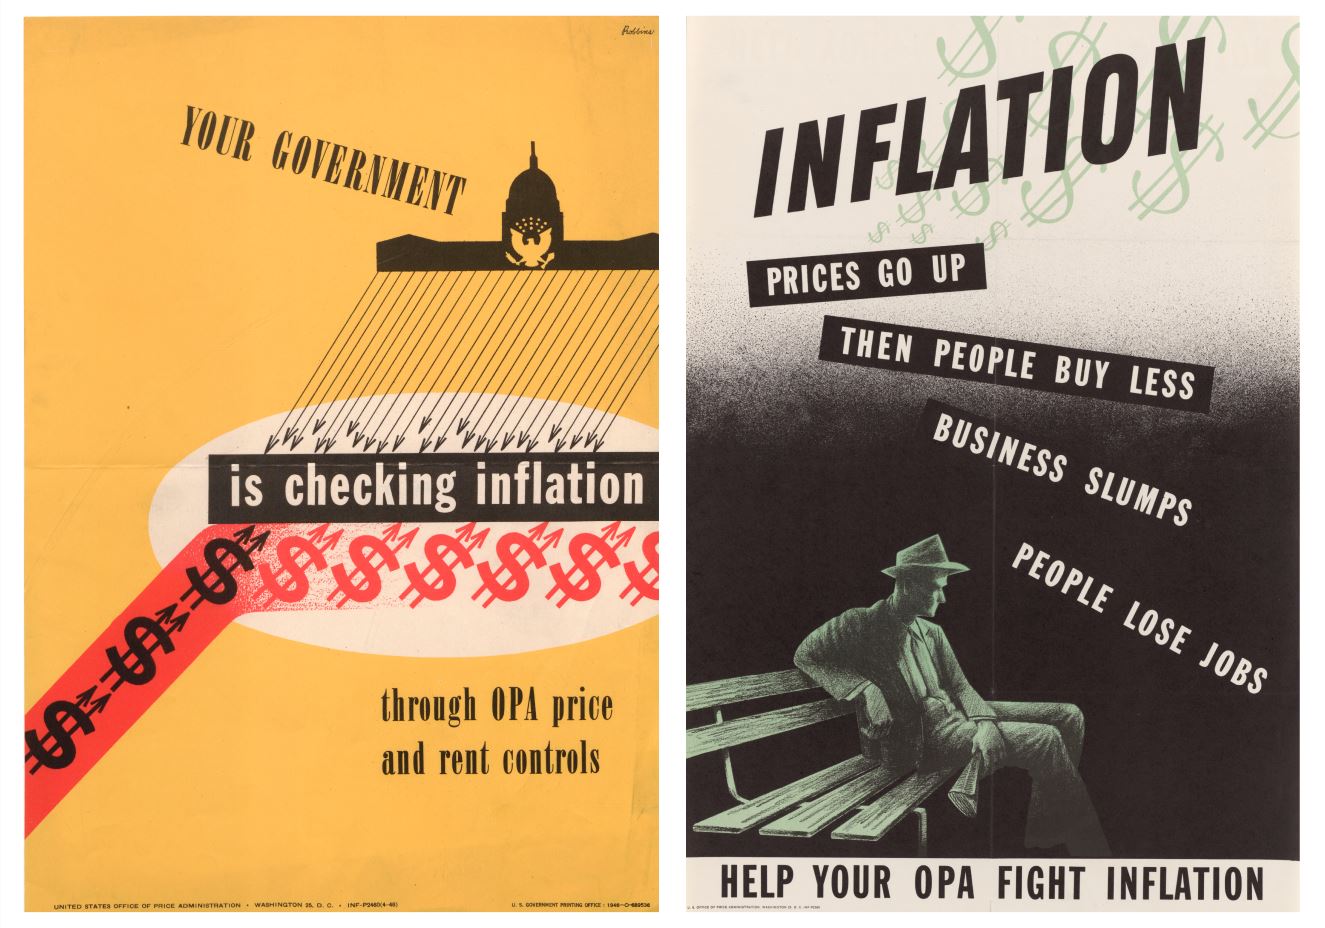
The post-World War II period is an interesting one to compare with our current post-COVID period. Both periods had unprecedented government stimulus and forced consumer saving. In both, after winning the war and after getting through the pandemic, inflation reared its ugly head.
POST-WWII ECONOMY
As the Allies pushed forward during WWII, the U.S. stock market continued its upward trajectory. The markets continued going up even during a technical recession that began in February 1945 and ended October 1945. The reason for this recession was the winding down of government spending on the war, which in turn caused GDP to decline by about 12%.
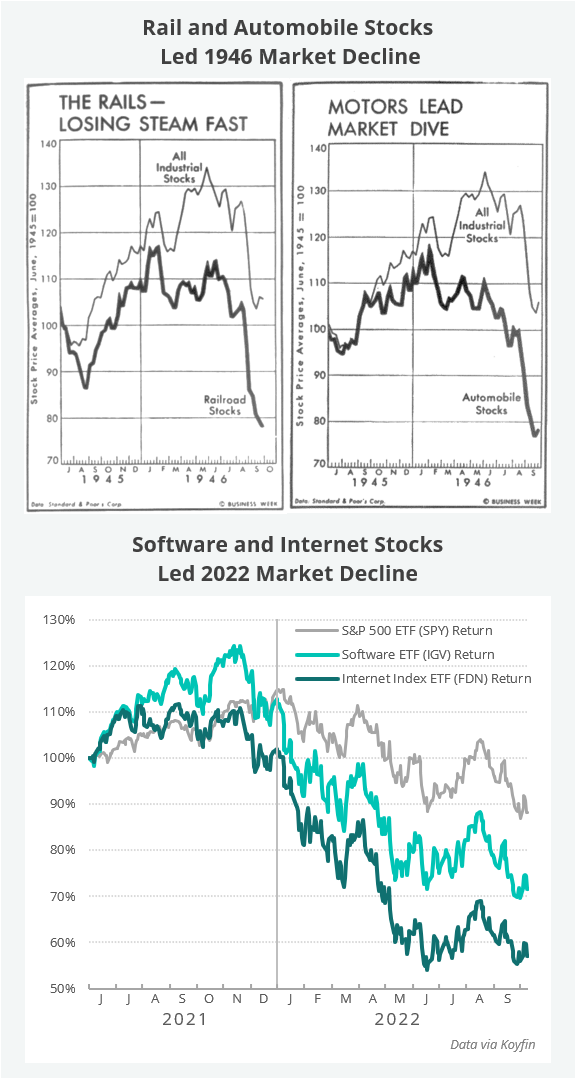
One might think that the end of a world war would be a good reason for markets to continue going up. However, this was not the case. The Dow-Jones Industrial index peaked in May 1946 and hit its lowest point of the year in October, a decline of about 25%. Sectors with the highest expectations—the automobile stocks and the rail stocks—peaked earlier and declined even more. Auto stocks declined 40% from peak to trough. Compare this to the software and internet/tech stocks of today, which have declined 40% or more from their peaks last year.
Another similarity between then and now is the extraordinary pent-up consumer demand. During the war, people earned high wages and had no way to spend their earnings. During the pandemic period of 2020 and 2021, consumers also engaged in forced saving. Many people could work from home and the government engaged in unprecedented support of the unemployed. When the war and pandemic periods ended, demand for consumer goods and services was insatiable, which helped kickstart a period of high inflation.
Although consumer demand was strong, economic challenges in the U.S. after the war were numerous. Businesses took longer than expected to reconfigure plants and supply chains from war time to peace time. There were still shortages of raw and partially finished materials necessary to make finished products. Like today, auto manufacturers couldn’t make enough cars to meet demand and the prices of new cars went higher and higher. A new car in 1946 sold for 50% higher than in 1941. Finally, the country also had to deal with thousands of labor strikes, many of which were settled with wage increases of 15%–20%.
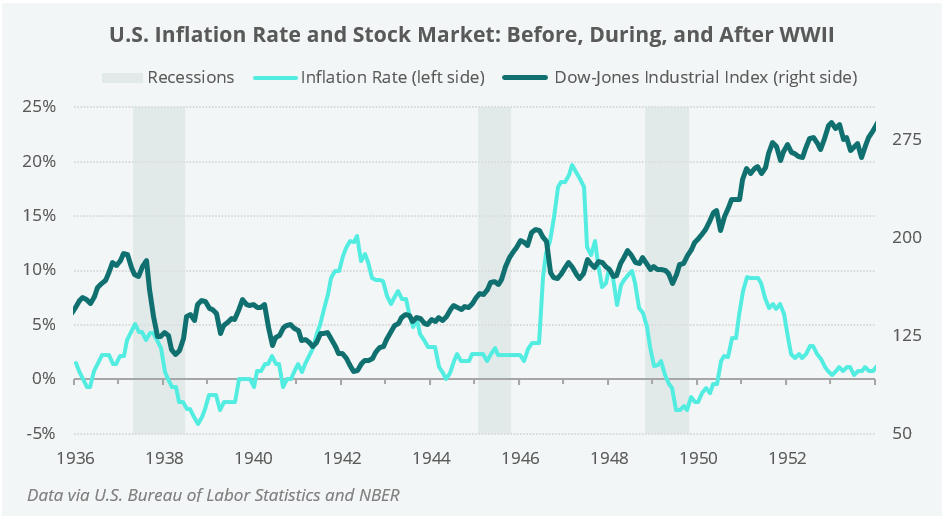
Rising input costs, material shortages, the end of war time price controls, voracious consumer demand, and other logistical challenges, all caused inflation to reach nearly 20% at its peak (see the above chart). High inflation, combined with high expectations for the stock market, caused the bear market in stocks in 1946. However, there was no economic recession that coincided with this ’46 bear market. The country continued to grow, consumer demand remained strong, and unemployment rose to just 5.2%—from 1948 through 2022, unemployment has averaged 5.7%.
ANDVARI TAKEAWAY
The 1946 bear market in stocks was a temporary phenomenon created by numerous challenges. And it was just a bear market in stocks, not the economy. Eventually, the economy adjusted itself, inflation subsided, and the stock market made new highs. We take comfort from the fact that businesses have survived and thrived in spite of tough times.
With all this said about just one period of history nearly 80 years ago, Andvari makes no predictions on when the current economy and markets will overcome their current challenges. Instead, we continue to do what we do in good years and bad. Andvari focuses on what is most within its control: to research and invest in excellent companies, run by great management teams, and that can earn exceptional returns for long periods of time.
We do know that our portfolio of companies will continue to grow and they will continue to compound their cash flows. When this happens, the intrinsic values of these businesses will increase. Over time, their share prices should follow the increase in intrinsic value.
As always, I love to hear from clients and anyone else. Please contact me with your thoughts, comments, or questions.
Sincerely,
Douglas E. Ott, II
DISCLOSURES AND END NOTES
* Andvari performance represents actual trading performance of all, actual clients beginning on 4/12/13. Performance from 12/31/12 to 4/12/13 is actual performance of proprietary accounts, namely the accounts of Andvari’s principal, Douglas Ott. Andvari believes including Ott’s performance figures for the first 4 months and 12 days of 2013 is fair as he managed those accounts similarly to Andvari’s first clients. All performance, including the initial proprietary period, are net of management fees—assumed to be 1.25% per annum, paid quarterly, as currently advertised—net of brokerage commissions and expenses, time-weighted, and includes all cash and other securities. Performance includes realized and unrealized returns and excludes the effects of taxes on incurred gains or losses. Andvari does not certify the accuracy of these numbers. Performance data quoted represents past performance and does not guarantee future results.
The exchange traded funds (ETFs) are listed as benchmarks and are total return figures and assumes dividends are reinvested. The SPY ETF is based on the S&P 500 Index, which is a float-adjusted, capitalization-weighted index of 500 U.S. large-capitalization stocks representing all major industries. The IWM ETF is based on the Russell 2000 Index, an index of 2,000 U.S. small-cap stocks. It is not possible to invest directly in an index. Because Andvari client portfolios are non-diversified, the performance of each holding will have a greater impact on results and may make them more volatile than a more diversified index. Andvari also engages or may engage in strategies not employed by the S&P 500 or the Russell 2000 including, without limitation, the use of leverage.
One may request a list of all securities mentioned or recommended for the preceding year as of the date of this letter. You may contact Andvari using the information below. Actual client results may differ from results depicted in this letter. Any investment involves substantial risks, including, but not limited to, pricing volatility, inadequate liquidity, and the loss of principal. Investment strategies managed by Andvari Associates LLC may have a position in the securities or assets discussed in this article. Securities mentioned may not be representative of the Andvari's current or future investments. Andvari may re-evaluate its holdings in any mentioned securities and may buy, sell or cover certain positions without notice.
The discussion of Andvari’s investments and investment strategy (including, but not limited to, current investment themes, the portfolio managers’ research and investment process, and portfolio characteristics) represents the views and opinions of Andvari’s portfolio managers and Andvari Associates LLC, the investment adviser, at the time of this report, and can change without notice.
This document does not in any way constitute an offer or solicitation of an offer to buy or sell any investment, security, or commodity discussed herein or of any of the affiliates of Andvari.
The information contained in this document may include, or incorporate by reference, forward-looking statements, which would include any statements that are not statements of historical fact. Any or all of Andvari’s forward-looking assumptions, expectations, projections, intentions or beliefs about future events may turn out to be wrong. These forward-looking statements can be affected by inaccurate assumptions or by known or unknown risks, uncertainties, and other factors, most of which are beyond Andvari’s control. Investors should conduct independent due diligence, with assistance from professional financial, legal and tax experts, on all securities, companies, and commodities discussed in this document and develop a stand-alone judgment of the relevant markets prior to making any investment decision.