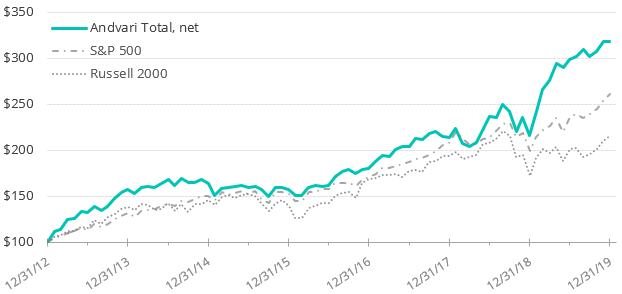
For the full year of 2019, Andvari was up 48.0% net of fees while the S&P 500 was up 31.5%.1 The chart shows the cumulative gains of hypothetical $100 investments.
ANDVARI’S HOLDINGS
[SECTION REDACTED - FULL LETTER AVAILABLE VIA CLIENT ACCESS]
THOUGHTS ON THE MARKET
With the market going up for so long, should investors be cautious and take some money off the table? Of course, everyone's situation is different, but all else equal, if one doesn't need their savings for the next ten years or longer, the best course of action is to remain invested. I've collected some interesting data that suggest the market is reasonably valued and could still provide some gains. Or at the minimum, this data ought to convince you that it’s an impossible task to time the market by selling before a decline and then getting back in before it rises.
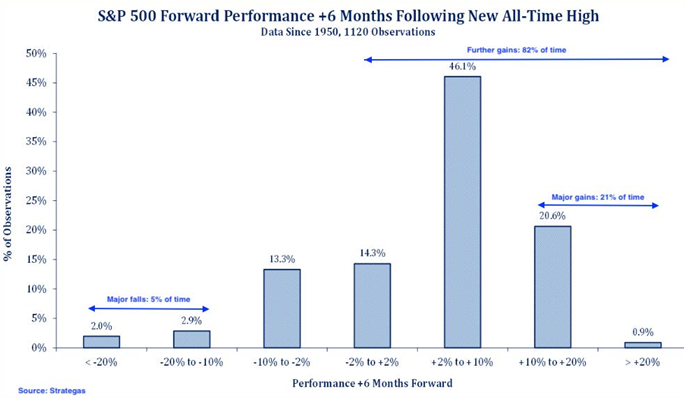
First, what usually happens when the stock market makes new highs? Data shows that stocks climb an average of 7.8% in the year after they achieve new all-time highs. Five years after hitting a new high, stocks rise another 32%, on average. Research firm Strategas also shows that after making a new all-time high, the market has positive performance in the following 6 months more than 80% of the time.
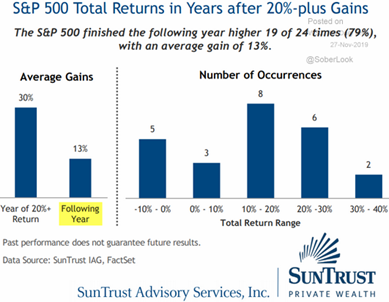
And when the market performs exceptionally well in a year, what happens the following year? The answer is the market has finished the following year higher 19 of 24 times, with an average gain of 13%.
Finally, one investing blogger compared historical returns for two different periods: as of the end of November 2019 and the other as of the end of December 1999. To remind you, December 1999 was just a few months away from the very top of the tech bubble. Comparing the two sets of returns suggests that the current market is nowhere close to bubble territory and there might even be room for reasonable returns (6-8% per year on average) over the next few years.
| S&P 500 Annualized Returns as of 11/2019 (ex. dividends) | S&P 500 Annualized Returns as of 12/1999 (ex. dividends) | |
| 1-year | 25.30% | 19.53% |
| 2-year | 8.39% | 23.05% |
| 3-year | 11.95% | 25.64% |
| 4-year | 11.34% | 24.28% |
| 5-year | 8.81% | 26.18% |
| 10-year | 10.91% | 15.31% |
| 20-year | 3.87% | 13.95% |
| 30-year | 7.55% | 9.67% |
| 50-year | 7.31% | 9.36% |
Although I am confident the market will produce positive returns over the next seven years, it is very likely it will be much less than what we’ve enjoyed. Over the last seven years, the S&P 500's total return has been 14.7% annualized, which is roughly double the long-term average. We all must lower our expectations for future performance.
SUMMARY
In closing, I remain deeply honored to have the privilege of investing the savings entrusted to Andvari. Looking at our historic returns, I know Andvari has made a meaningful difference for its clients. Our above-average returns have come from our careful and concentrated style of investing, where we invest in only a handful of companies and where we put most of our money into our best ideas. Our returns have also come from Andvari's high-quality clients, all of whom are patient and appreciate Andvari's investment style. This stable base of capital has allowed Andvari to make investments based on what we think will happen to a company over the long-term, not the short-term.
I love to hear from clients and interested parties about anything on their mind, so please contact me with your questions, your thoughts, or if you’re just bored! I wish you all a happy and prosperous new year.
Sincerely,
Douglas Ott
1 Performance data quoted represents past performance and does not guarantee future results. “Andvari Total” represents all of Douglas Ott’s investment accounts and all the discretionary accounts Andvari manages where it takes an active role in picking individual stocks and receives a fee. From 12/31/12 to 4/12/13 results included only Ott’s personal and retirement accounts—the first Andvari clients transferred their accounts on 4/12/13. Andvari believes including Ott’s performance figures for the first 4 months of 2013 is fair as he managed those assets similarly to later clients. Results are net of management fees (1% per annum), time-weighted, and includes all cash and other securities. The indexes are listed as benchmarks and are total return figures and assumes dividends are reinvested. The S&P 500 Total Return Index is a float-adjusted, capitalization-weighted index of 500 U.S. large-capitalization stocks representing all major industries. The Russell 2000 Index is an index of 2,000 U.S. small-cap stocks. It is not possible to invest directly in an index. Because Andvari is non-diversified, the performance of each holding will have a greater impact on Andvari's results and may make them more volatile than a more diversified index.
—
**ANDVARI NEWSLETTER**
Get more with Andvari's e-newsletter. Every two weeks, we share insights on great companies, exceptional leaders in business, and related topics in a digestible email format. Click here to sign-up.
-
IMPORTANT DISCLOSURE AND DISCLAIMERS
Investment strategies managed by Andvari Associates LLC ("Andvari") may have a position in the securities or assets discussed in this article. Andvari may re-evaluate its holdings in such positions and sell or cover certain positions without notice.
This document and the information contained herein are for educational and informational purposes only and do not constitute, and should not be construed as, an offer to sell, or a solicitation of an offer to buy, any securities or related financial instruments. This document contains information and views as of the date indicated and such information and views are subject to change without notice. Andvari has no duty or obligation to update the information contained herein. Past investment performance is not an indication of future results. Full Disclaimer.
© 2020 Andvari Associates LLC